How to Calculate Your Engagement Rate on Instagram, TikTok, and YouTube
Engagement rate is the single most important metric for creators and brands. It measures how much your audience actually cares about your content — not just how big your following is. A creator with 5,000 highly engaged followers will consistently outperform one with 500,000 passive ones when it comes to brand deals, algorithm reach, and actual influence.
This guide covers the exact formulas for calculating engagement rate on Instagram, TikTok, and YouTube, along with benchmark data by follower count so you know where you stand. No guesswork, just the numbers.
Want to calculate your engagement rate right now? Free calculators for Instagram, TikTok, and YouTube.
Check Your Engagement Rate →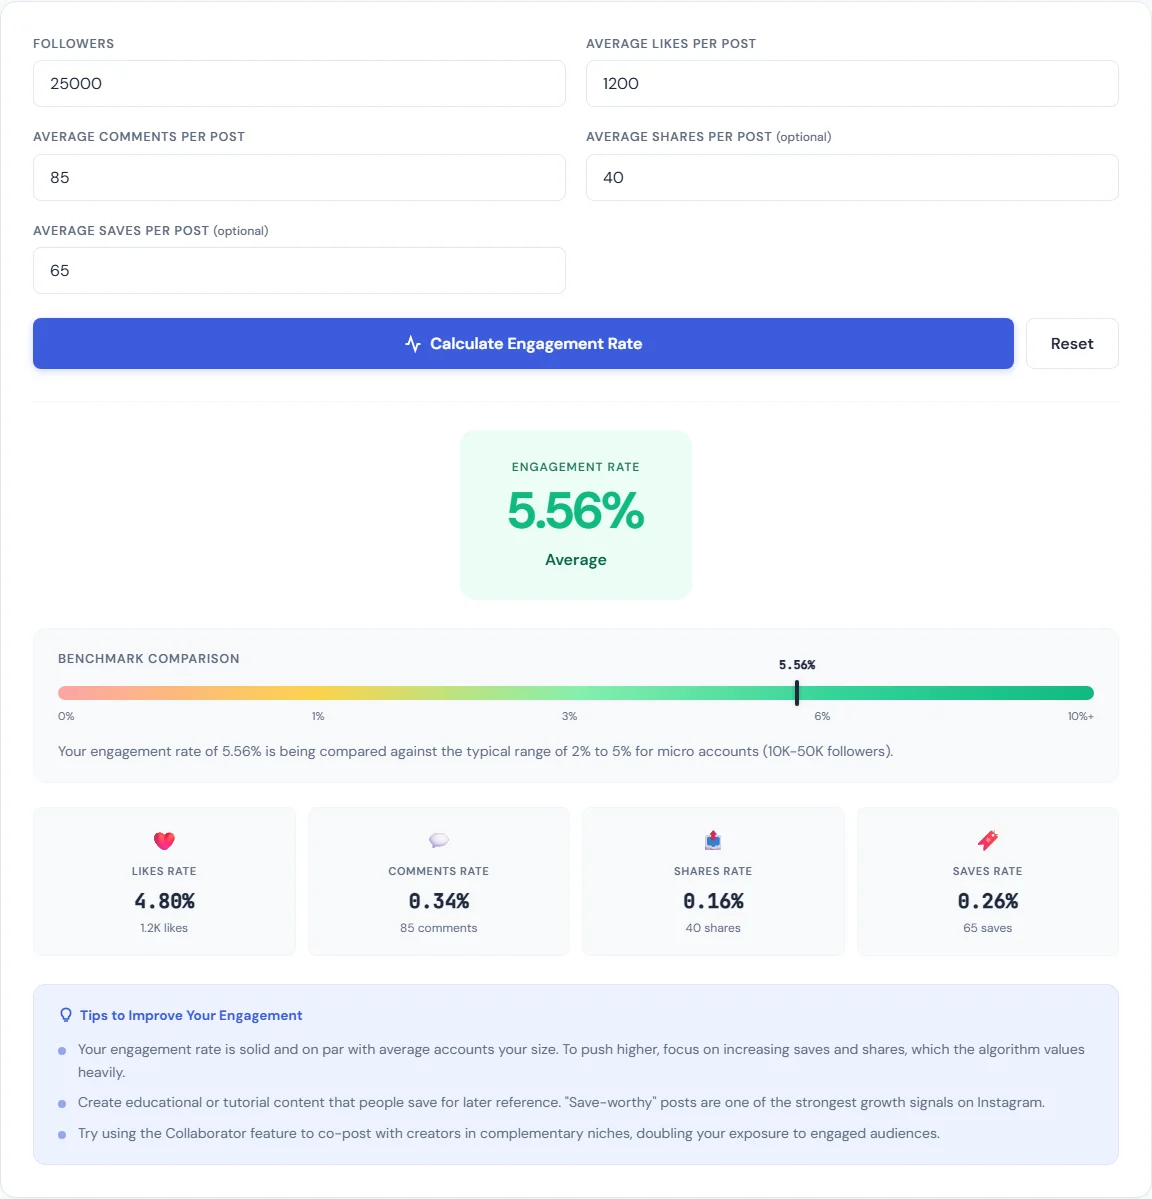
What Is Engagement Rate?
Engagement rate is a percentage that represents how actively your audience interacts with your content. The core formula is simple:
Engagement Rate = (Total Interactions ÷ Audience Size) × 100
Interactions include likes, comments, shares, saves, and other measurable actions. Audience size is either your follower count or your view count, depending on the platform. The result is a percentage — the higher it is, the more your audience is paying attention.
Each platform defines "interactions" and "audience" slightly differently, which is why you need platform-specific formulas. Here is how each one works.
How to Calculate Instagram Engagement Rate
Instagram engagement rate is calculated using followers as the denominator. The standard formula is:
Instagram Engagement Rate = (Likes + Comments) ÷ Followers × 100
For example, if a post gets 300 likes and 20 comments and you have 8,000 followers, your engagement rate is (320 ÷ 8,000) × 100 = 4.0%.
Some variations include saves and shares in the numerator, but the likes + comments formula is the industry standard used by most brands and agencies for benchmarking. Use our free Instagram Engagement Calculator to run the numbers instantly.
Instagram Engagement Rate Benchmarks by Follower Count
- Nano-influencers (1K–10K followers): 4–6% average engagement rate
- Micro-influencers (10K–50K followers): 2–4% average engagement rate
- Mid-tier creators (50K–500K followers): 1.5–2.5% average engagement rate
- Macro-influencers (500K+ followers): 1–2% average engagement rate
If your rate falls below these ranges, your content may not be resonating with your audience or the algorithm is limiting your reach. If you are above these benchmarks, you are in strong shape for monetization.
How to Calculate TikTok Engagement Rate
TikTok engagement rate uses views as the denominator, not followers. This is a critical distinction. TikTok's algorithm distributes content to non-followers far more aggressively than Instagram, so measuring against views gives a more accurate picture of how your content performs with the people who actually see it.
TikTok Engagement Rate = (Likes + Comments + Shares) ÷ Views × 100
For example, if a video gets 5,000 likes, 200 comments, and 150 shares with 80,000 views, your engagement rate is (5,350 ÷ 80,000) × 100 = 6.7%.
Use our free TikTok Engagement Calculator to check your rate across multiple videos.
TikTok Engagement Rate Benchmarks
- 4–8% is considered average on TikTok
- 10%+ is excellent and indicates strong content-audience fit
- Below 3% suggests your content is being served but not connecting
TikTok benchmarks tend to be higher than Instagram because the view-based denominator only counts people who actually watched the video. On Instagram, the follower-based denominator includes people who may never have seen the post.
How to Calculate YouTube Engagement Rate
YouTube engagement rate is also view-based:
YouTube Engagement Rate = (Likes + Comments) ÷ Views × 100
For example, if a video gets 1,200 likes and 80 comments with 30,000 views, your engagement rate is (1,280 ÷ 30,000) × 100 = 4.3%.
Use our free YouTube Engagement Calculator to calculate your rate and compare it against benchmarks.
YouTube Engagement Rate Benchmarks
- 2–5% is considered good for most niches
- A typical like ratio is 4–5% of total views (meaning if 100 people watch, 4–5 will hit the like button)
- Comment rates are much lower — 0.5–1% of views is normal
YouTube's algorithm weighs watch time and click-through rate more heavily than likes and comments, but engagement rate still matters for social proof, brand evaluations, and understanding audience sentiment.
Why Engagement Rate Matters More Than Follower Count
Follower count is a vanity metric. Engagement rate is a performance metric. Here is why the distinction matters:
- Brand deals are priced on engagement. Brands and agencies evaluate creators based on engagement rate, not raw follower numbers. A creator with 15,000 followers and a 5% engagement rate is more valuable than one with 200,000 followers and a 0.5% rate because the smaller creator drives more actual interactions per dollar spent.
- Algorithms reward engagement. Instagram, TikTok, and YouTube all use engagement signals to decide how widely to distribute content. Posts with high engagement get pushed to more feeds, Explore pages, and For You pages. Low engagement tells the algorithm to stop showing your content.
- Community strength compounds. Engaged audiences share your content, tag friends, respond to stories, and buy products. Passive followers scroll past. Over time, high engagement creates a compounding growth loop that follower farming never will.
- Micro-influencers often outperform macro-influencers. Data consistently shows that creators in the 1K–50K range generate higher engagement rates than those with 500K+ followers. Brands know this, which is why micro-influencer campaigns have become the default strategy for performance-driven marketing.
How to Improve Your Engagement Rate
If your engagement rate is below the benchmarks listed above, here are specific actions that move the numbers:
- Post consistently. Irregular posting trains your audience to stop checking for your content. Pick a frequency you can sustain — three times per week is better than seven times one week and zero the next.
- Use calls to action. Explicitly ask your audience to comment, share, or save. Posts that ask a direct question in the caption consistently get 2–3x more comments than those that do not. "What do you think?" is weak. "Which one would you pick — A or B?" is specific and actionable.
- Reply to every comment. Each reply counts as an additional comment, doubling your comment count. More importantly, it signals to the algorithm that your post is generating conversation, which boosts distribution.
- Post at optimal times. Check your platform analytics for when your audience is most active. Posting when your followers are online gives your content the initial engagement burst that algorithms use to decide whether to push it further.
- Use Stories, Shorts, and Reels. Short-form and ephemeral content formats consistently drive higher engagement rates than static feed posts. They also keep you visible to your audience between main posts.
- Avoid engagement bait. "Like if you agree" and follow-for-follow tactics generate hollow engagement that platforms are increasingly penalizing. Focus on content that earns genuine interactions.
Setting Your Sponsorship Rate
Once you know your engagement rate, you can calculate what to charge for sponsored content. The general formula used across the industry is:
Sponsorship Rate = Engagement Rate × Followers × Rate Multiplier
The rate multiplier varies by niche, platform, and content format, but typically ranges from $0.05 to $0.25 per engaged follower. Use our Influencer Rate Calculator to get a data-backed estimate for your specific numbers.
For YouTube creators specifically, sponsorship rates also factor in CPM and average views per video. Our YouTube Revenue Calculator can help you estimate both ad revenue and sponsorship value based on your channel metrics.
The key point: higher engagement rates justify higher rates. A creator with a 5% engagement rate can reasonably charge more per follower than one with a 1% rate, because each impression is more likely to result in action.
Tools for Content Creators
Beyond engagement calculators, content creation involves a lot of repetitive production work. Here are two tools that save time on the visual side:
- Social Media Resizer — Resize any image to the exact dimensions required by Instagram, TikTok, YouTube, Twitter, LinkedIn, and Facebook. One upload, every size you need.
- Image Compressor — Compress thumbnails and post images to reduce file size without visible quality loss. Faster uploads, better load times on your link-in-bio pages.
Both tools run entirely in your browser. No uploads to external servers, no sign-ups, no daily limits.
Wrapping Up
Engagement rate tells you whether your content is working. Calculate it regularly, benchmark it against the numbers above, and track it over time. If the rate is climbing, your content strategy is on the right track. If it is dropping, something needs to change — your posting schedule, your content format, or how you are engaging with your audience.
Use the free calculators linked throughout this guide to check your numbers right now. Knowing your engagement rate is the first step to growing smarter, not just bigger.

BLIPP built SmarterSources to replace expensive subscriptions with free, private tools. Every tool runs in your browser — no sign-ups, no limits.