How Much House Can You Actually Afford? A Step-by-Step Guide
You found a house listed at $350,000. You can picture yourself in it. But before you start mentally arranging furniture, there is a question most first-time buyers skip past too quickly: what will this home actually cost you every month?
The listing price is just the starting point. Between mortgage interest, property taxes, insurance, PMI, and closing costs, the real price tag is significantly higher than the number on the sign. Most first-time buyers underestimate these costs by thousands of dollars per year, and that gap is where financial stress starts.
This guide walks through the math step by step, so you can figure out what you can genuinely afford — not what a lender says you qualify for, but what actually fits your life. Along the way, we will use free calculators to make the numbers concrete.
Want to see how much house you can afford? The calculator runs instantly in your browser.
Check Your Affordability →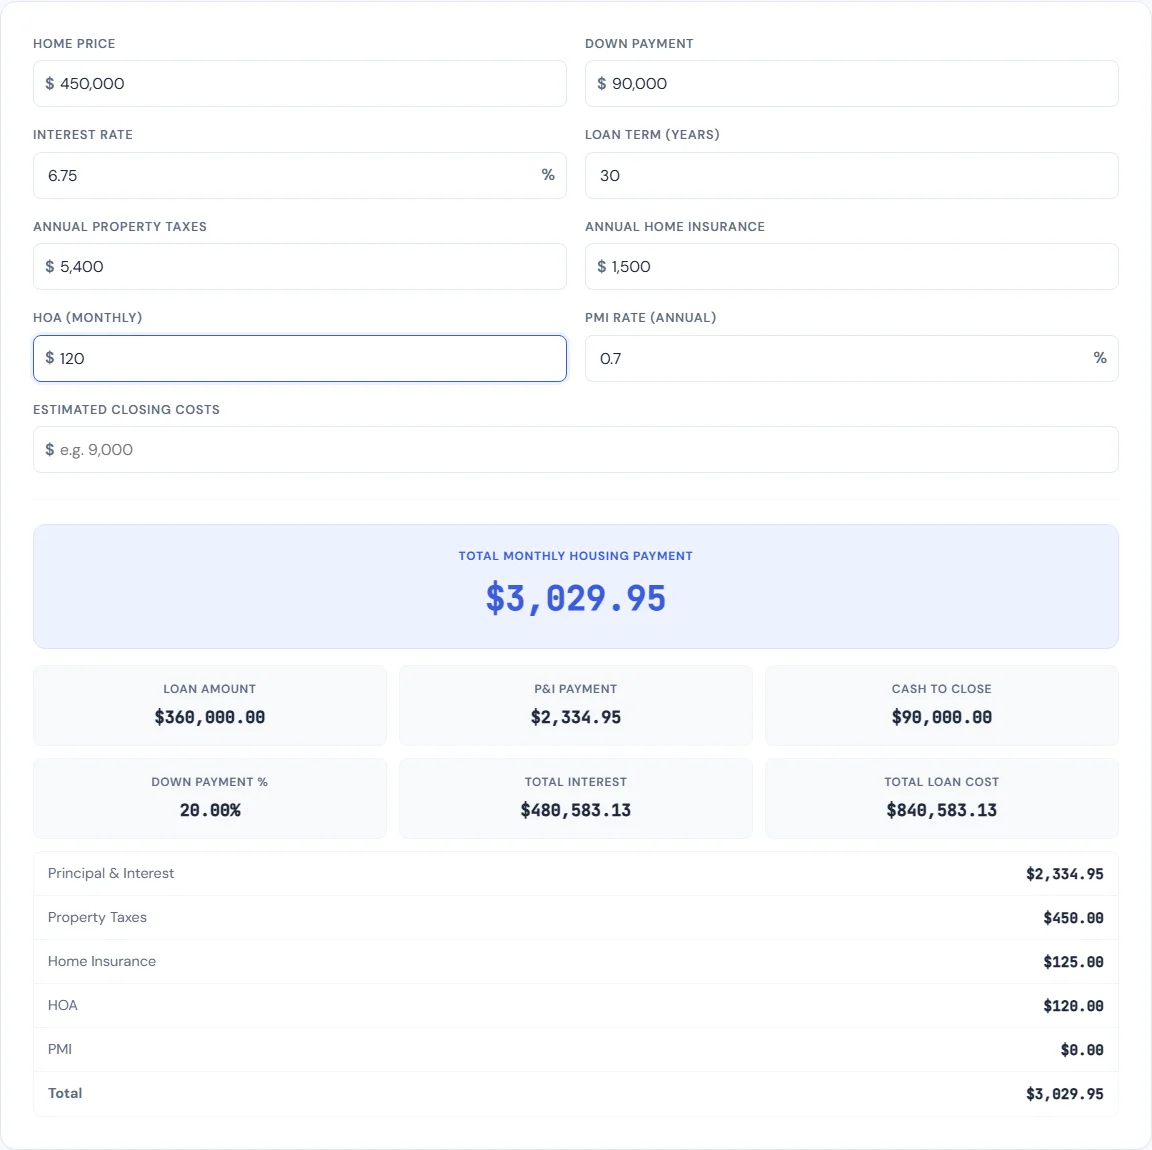
The 28/36 Rule — What Lenders Actually Look At
Before you even look at a listing, lenders will evaluate your finances using two ratios:
- Front-end ratio (28%): Your total monthly housing costs — mortgage payment, property taxes, homeowners insurance, and any HOA fees — should not exceed 28% of your gross monthly income.
- Back-end ratio (36%): Your total monthly debt payments — housing costs plus car loans, student loans, credit cards, and any other debt — should not exceed 36% of your gross monthly income.
Here is what that looks like in practice. If your household earns $85,000 per year, your gross monthly income is about $7,083. Under the 28/36 rule:
- Maximum housing payment: $7,083 x 0.28 = $1,983/month
- Maximum total debt: $7,083 x 0.36 = $2,550/month
If you already pay $400/month toward a car loan and $200/month toward student loans, your back-end limit leaves $1,950 for housing — which is actually lower than the front-end cap. The tighter number wins. Use the Affordability Calculator to plug in your exact income and debts and see where you land.
Breaking Down Your Monthly Mortgage Payment
When people say "mortgage payment," they usually mean just the loan. But your actual monthly payment includes four components, often called PITI:
- Principal: The portion that pays down the loan balance. Early in your mortgage, this is a small fraction of each payment.
- Interest: The cost of borrowing the money. At a 6.5% rate, interest dominates your payment for the first 10-15 years.
- Taxes: Property taxes vary widely by location — from under 0.5% to over 2% of home value per year. On a $350,000 home, that could mean anywhere from $1,750 to $7,000 annually. The Property Tax Calculator can help you estimate based on your area.
- Insurance: Homeowners insurance typically runs $1,200 to $2,500 per year, depending on the home and location.
There is a fifth component that catches many buyers off guard: Private Mortgage Insurance (PMI). If your down payment is less than 20%, lenders require PMI, which typically costs 0.5% to 1% of the loan amount per year. On a $280,000 loan, that adds $1,400 to $2,800 annually — or roughly $117 to $233 per month.
How to Calculate Your Mortgage Payment
Let us walk through a real example using the Mortgage Payment Calculator.
Scenario: You are buying a $350,000 home with 20% down at a 6.5% interest rate on a 30-year fixed mortgage.
- Down payment: $350,000 x 0.20 = $70,000
- Loan amount: $350,000 - $70,000 = $280,000
- Monthly principal and interest: $1,770
- Estimated property taxes (1.1%): $321/month
- Estimated homeowners insurance: $150/month
- PMI: $0 (20% down eliminates this)
- Total monthly payment: approximately $2,241
Over 30 years, you will pay roughly $637,200 in principal and interest alone — meaning you pay $357,200 in interest on top of the $280,000 you borrowed. That is the real cost of a mortgage, and seeing it broken down makes the case for larger down payments and shorter loan terms.
Try adjusting the numbers in the Mortgage Payment Calculator. Change the rate to 7%, drop the down payment to 10%, or switch to a 15-year term. Small changes in these variables shift your monthly payment by hundreds of dollars.
Down Payment — How Much Do You Really Need?
One of the most persistent myths in home buying is that you need 20% down. You do not. Here are the actual minimums:
- Conventional loans: As low as 3% to 5% down. On a $350,000 home, that is $10,500 to $17,500.
- FHA loans: 3.5% down with a credit score of 580 or higher. That is $12,250 on a $350,000 home.
- VA loans: 0% down for eligible veterans and active military.
- USDA loans: 0% down for eligible rural properties.
The trade-off for a smaller down payment is PMI and a larger loan balance. Putting 5% down on a $350,000 home means borrowing $332,500 instead of $280,000. Your monthly principal and interest jumps from $1,770 to $2,102, and you add PMI on top of that.
Use the Down Payment Calculator to compare different down payment scenarios side by side. It shows you exactly how much more you pay in interest and PMI at each level, so you can find the right balance between saving longer and buying sooner.
Closing Costs — The Hidden Expense
Closing costs are the fees you pay when the sale becomes final. Most buyers budget for the down payment but forget about this second lump sum.
Typical closing costs run 2% to 5% of the home's purchase price. On a $350,000 home, that is $7,000 to $17,500. These costs include:
- Loan origination fees (0.5% to 1% of the loan)
- Appraisal fee ($300 to $600)
- Title insurance and title search ($500 to $1,500)
- Home inspection ($300 to $500)
- Prepaid property taxes and insurance (several months upfront)
- Attorney fees, recording fees, and transfer taxes (varies by state)
Some of these are negotiable, and in some markets sellers will cover part of the buyer's closing costs. But plan for them. Run the numbers through the Closing Cost Estimator so you know exactly what to expect before you get to the closing table.
Should You Rent or Buy?
Buying is not automatically better than renting. It depends on several factors that are specific to your situation:
- How long you plan to stay: The break-even point — where buying becomes cheaper than renting — is typically 5 to 7 years, depending on your market. If you might move in 2 to 3 years, buying could cost you money.
- Local market conditions: In some cities, renting is significantly cheaper than owning on a monthly basis. In others, mortgage payments are comparable to or lower than rent.
- Opportunity cost: The money you put into a down payment could be invested elsewhere. If the stock market returns 8% annually and your home appreciates 3%, the math is not straightforward.
- Maintenance and repairs: Homeowners typically spend 1% to 2% of the home value per year on maintenance. On a $350,000 home, that is $3,500 to $7,000 annually that renters do not pay.
The Rent vs Buy Calculator lets you input your rent, potential purchase price, down payment, interest rate, and how long you plan to stay. It shows you the total cost of each option so you can make the decision based on math, not emotion.
Refinancing — When Does It Make Sense?
If you already own a home, refinancing replaces your current mortgage with a new one — ideally at a lower interest rate. The general rule of thumb: refinancing makes sense when you can reduce your rate by at least 1 percentage point and you plan to stay in the home long enough to recoup the closing costs.
For example, if you have a $280,000 balance at 7.5% and refinance to 6.5%, your monthly principal and interest drops from roughly $1,958 to $1,770 — a savings of $188 per month. If refinancing costs you $5,000 in fees, you break even in about 27 months. Everything after that is savings.
The Refinance Calculator shows your monthly savings, total interest saved, and break-even timeline. It also factors in whether you are better off shortening your loan term instead of lowering your payment.
Beyond the Calculators — Other Financial Planning Tools
Buying a home does not happen in isolation. It connects to every other part of your financial life. Here are a few tools worth using alongside the mortgage calculators:
- Budget Calculator — Map out your income and expenses to see where a mortgage payment fits. If the numbers feel tight, you will see exactly where to adjust.
- Savings Goal Calculator — Building a down payment takes time. Plug in your target amount, timeline, and current savings to figure out how much to set aside each month.
- Debt Payoff Calculator — If existing debt is pushing you past the 36% back-end ratio, this tool creates a payoff plan that frees up room for a mortgage.
- Retirement Calculator — Make sure your housing costs are not crowding out retirement contributions. A home is an asset, but it is not a retirement plan on its own.
If you are considering selling your current home to buy a new one, the Net Proceeds Calculator shows how much cash you will walk away with after agent commissions, closing costs, and your remaining mortgage balance.
The Bottom Line
Figuring out how much house you can afford is not about finding the maximum number a lender will approve. It is about understanding every cost — monthly payments, upfront expenses, and long-term interest — and making sure they fit comfortably within your financial life.
Start with the Affordability Calculator to get your baseline number. Then use the Mortgage Payment Calculator to break down the monthly costs on specific homes you are considering. Run the Closing Cost Estimator so there are no surprises at the table. And if you are still deciding whether to buy at all, let the Rent vs Buy Calculator settle the debate with real numbers.
The math is not complicated. You just need the right tools — and now you have them.

BLIPP built SmarterSources to replace expensive subscriptions with free, private tools. Every tool runs in your browser — no sign-ups, no limits.